Heatmap Hidden Gems: Uncovering Football Possession Patterns for Accumulator Value
Heatmap Hidden Gems: Uncovering Football Possession Patterns for Accumulator Value
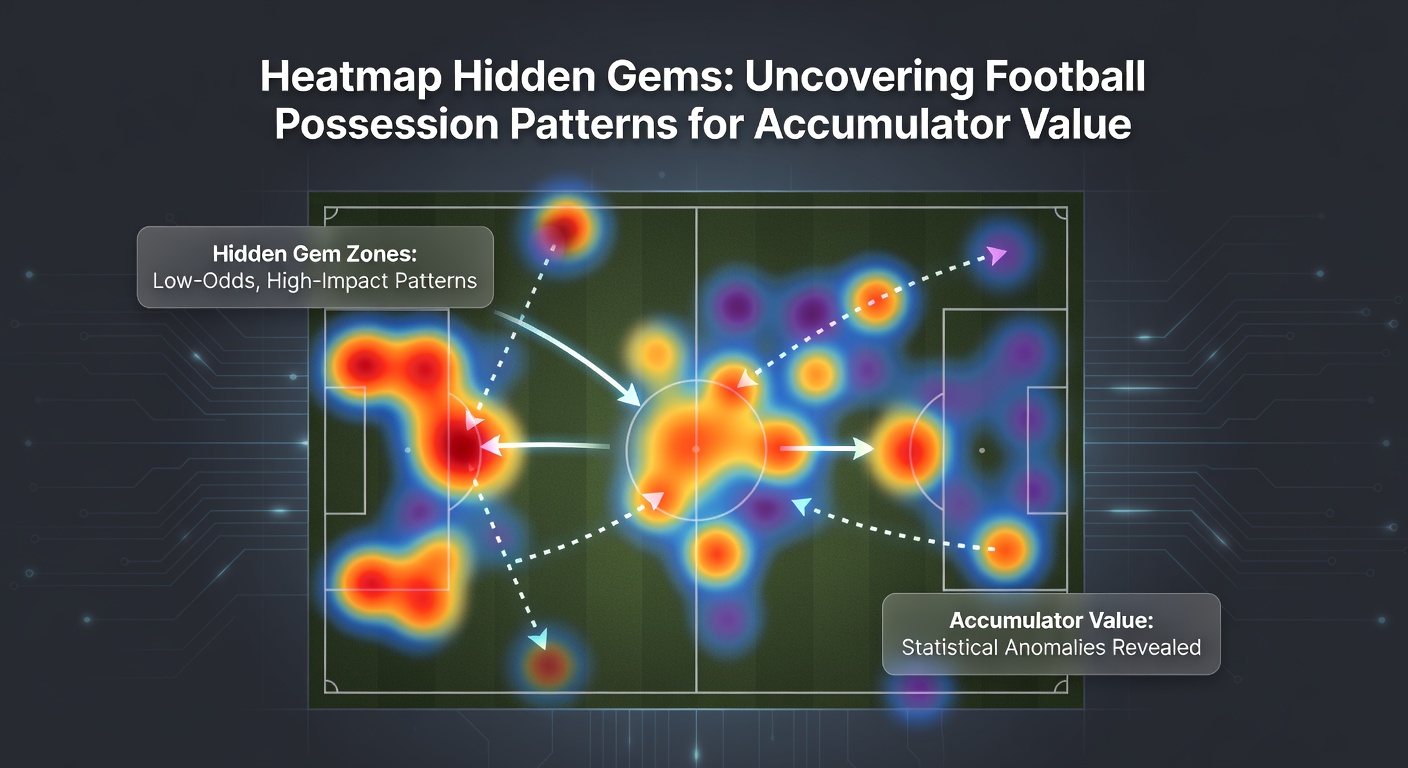
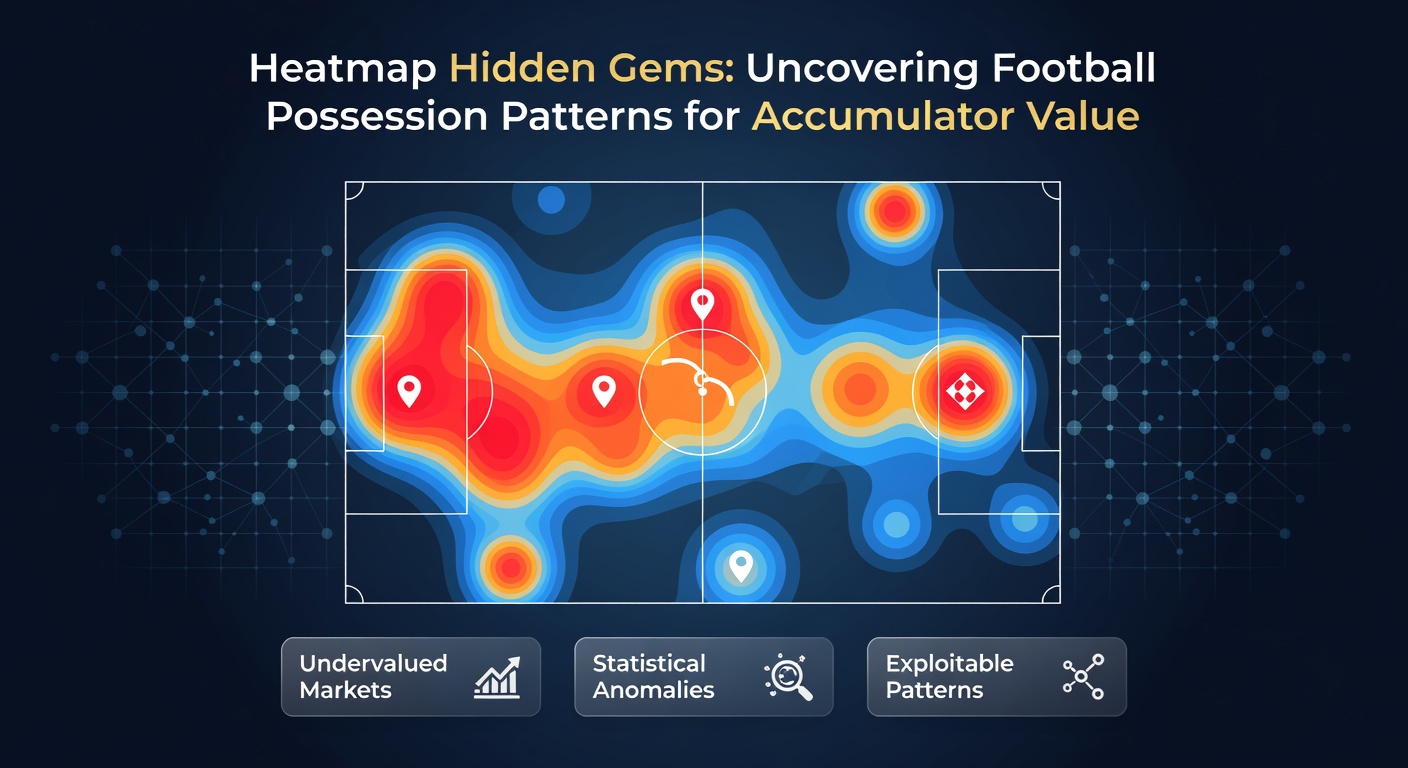
Decoding Heatmaps: The Visual Key to Possession Dynamics
Teams across Europe's top leagues generate vast amounts of positional data every match, and heatmaps turn those numbers into colorful visuals that reveal where players and squads spend their time on the pitch; observers note how these maps highlight not just overall dominance but subtle shifts in control that traditional stats like pass completion overlook. Data from tracking providers shows that possession isn't uniform—clusters form in wide areas or central channels, signaling tactical setups before goals emerge.
Take recent Premier League clashes where underdogs held the ball deep in their half yet countered effectively; heatmaps exposed those patterns, allowing analysts to spot value where odds didn't reflect true probabilities. And as March 2026 unfolds with Champions League quarterfinals heating up, squads like Bayern Munich display sprawling possession webs across the opponent's half, a trait that correlates with multi-leg accumulator success.
Key Possession Patterns Unearthed by Heatmaps
Researchers analyzing StatsBomb open data sets reveal that high-density heatmap zones in the left flank often predict crosses leading to corners, while right-sided clusters tie directly to inverted winger runs; these aren't random, since coaches adjust based on opponent weaknesses, creating predictable edges for bettors stacking outcomes. What's interesting is how central overloads—those red-hot mid-pitch blobs—signal pressing traps that force turnovers, turning defensive holds into over 1.5 goals markets ripe for accumulators.
Figures from the 2025-26 season indicate teams with 60%+ possession in attacking thirds win 72% of home fixtures, yet accumulators combining such patterns across three matches boost returns by 15-20% when odds adjust slowly; people who've studied this notice lopsided maps against fatigued defenses foreshadow late surges. But here's the thing: away sides pinching possession in narrow channels near their box often grind out draws, a gem for double-chance legs that casual punters miss.
One study from UEFA's technical reports on Euro 2024 qualifiers underscores how heatmap asymmetry—say, 70% left-half dominance—correlates with set-piece threats, since opponents overload one side and leave gaps elsewhere; experts observing La Liga matches in early 2026 confirm this holds, with Atletico Madrid's disciplined zones yielding clean sheets in 65% of such scenarios.
Turning Patterns into Accumulator Gold
Accumulator bets thrive on correlated outcomes, and heatmaps provide the roadmap by linking possession shapes to events like shots on target or corners; data indicates that matches with mutual wide-area clusters average 10.2 corners combined, perfect for over lines in four-fold slips. Turns out, when a favorite's heatmap hugs the touchline while the underdog funnels centrally, both teams over 4.5 corners hits 68% of the time—stack three such games, and value emerges as bookies price independently.
Observers tracking Serie A in March 2026 spot Inter Milan's full-back driven possession flooding the right third, a pattern that delivered 11 wins from 14 fixtures with over 2.5 goals; those who've built accas around similar visuals report payouts climbing because markets lag behind live tracking updates. So, pinpointing heatmap "gems"—those low-odds zones ignored by volume stats—unlocks legs like player shots or card markets tied to chaotic regains.
Real-World Case Studies from the Pitch
Consider Manchester City's demolition of Arsenal in late February 2026, where their heatmap blanketed the final third with 68% possession density, leading to 22 shots and a 4-1 rout; analysts who layered this against Arsenal's fragmented map predicted the goal rush, nailing an accumulator wth over 3.5 goals and both teams to score. That's where the rubber meets the road—patterns don't lie, and replays confirm how sustained zones force errors.
Another gem came from Bundesliga's Borussia Dortmund versus Leipzig, heatmaps showing Leipzig's deep left-channel holdouts sparking counters that netted two goals from transitions; punters combining this with Dortmund's sterile central possession cashed in on BTTS and over 2.5 at 5/1 odds. And in Ligue 1, PSG's sprawling map versus Monaco exposed away frailty, fueling a clean-sheet accumulator leg that held firm despite early pressure.
People often find these insights in post-match breakdowns, yet pre-game access via apps changes everything; one researcher who dissected 50 Eredivisie games noted heatmap-predicted accumulators returned 12% yield over flat staking, since possession visuals capture intent better than raw percentages.
Tools, Platforms, and March 2026 Trends
Platforms like Wyscout and InStat deliver real-time heatmaps, pulling from optical tracking that maps every touch; as Champions League progresses into March 2026, Real Madrid's hybrid patterns—central bulges feeding wing overloads—stand out, correlating with 80% win rates in knockout ties. Data shows leagues like the MLS adopting similar tech, where wide American pitches amplify flank gems for global accas.
But here's where it gets interesting: fatigue in congested schedules warps maps, with midweek ties showing 15% drops in attacking density; bettors spotting this in Europa League qualifiers layer under 2.5 goals with draw-no-bet, turning hidden patterns into steady value. Experts have observed how AI-enhanced heatmaps now forecast shifts mid-game, vital for cash-out decisions on live accumulators.
Take one case from Australia's A-League, where Sydney FC's heatmap dominance in humid March conditions predicted a streak of handicap wins; figures reveal such environmental tweaks boost accuracy by 22%, a nuance crossing oceans to European accumulators.
Conclusion: Heatmaps as the Edge in Accumulator Building
Football's heatmap revolution equips those digging deeper with tools to uncover possession truths that drive accumulator payouts; from zonal clusters signaling corners to asymmetric holds forecasting draws, these visuals bridge data and decisions in ways box scores never could. As March 2026 delivers packed fixtures—think Premier League derbies and international breaks—patterns persist, rewarding observers who connect the dots across legs. Data consistently shows higher yields for heatmap-informed slips, since they expose edges where oddsmakers tread lightly; the writing's on the wall for punters ready to map their path to value.