League Phase Fatigue Cycles: Mapping Squad Rotation Data for Midweek Football Value Accumulators
European football calendars pack midweek fixtures into league phases where squad rotation becomes essential for managing player workloads and observers note that data on these patterns reveals measurable impacts on match outcomes. Teams competing in continental competitions face compressed schedules and researchers tracking rotation metrics find that starters rested during European ties often return fresher for domestic league games while those logging high minutes show declines in key performance areas such as sprint distance and pass accuracy.
Understanding Rotation Patterns in League Phases
League phases in the Champions League and Europa League run from September through January with multiple matchdays creating cycles of high and low intensity that force managers to balance selection choices across competitions. Data from the 2025/26 season shows clubs averaging three to four changes in starting lineups after midweek European fixtures and this rotation correlates with improved recovery metrics tracked by GPS systems. Sports scientists at institutions like the University of Porto have documented how these adjustments reduce injury risk while maintaining competitive edges in domestic play.
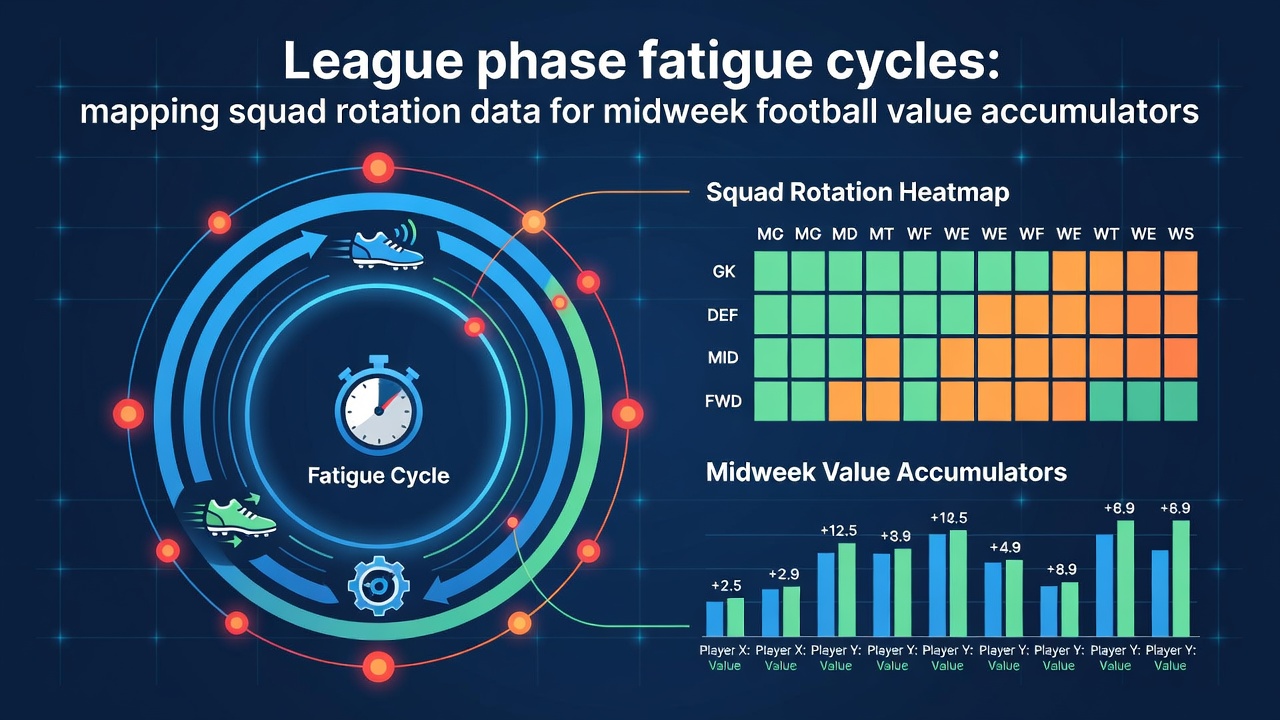
Rotation data also highlights positional trends where midfielders and fullbacks experience the highest minute loads across weeks and clubs respond by deploying specialized substitutes who log fewer than sixty minutes per appearance. Analysts mapping these cycles identify clusters where teams rotate heavily before high-stakes weekend derbies and the resulting squad freshness translates into higher expected goal outputs in those specific fixtures.
Data Sources and Mapping Techniques
Comprehensive squad rotation datasets come from platforms aggregating match logs across Europe's top five leagues and these records allow for the construction of fatigue indices based on consecutive appearances and travel distances. UEFA technical reports provide supplementary benchmarks on recovery times between midweek and weekend games while academic papers from Canadian universities examine similar workload patterns in North American soccer contexts to draw comparative insights. One study released in early 2026 analyzed over 12,000 player appearances and isolated rotation frequency as a predictor variable for performance variance in league matches.
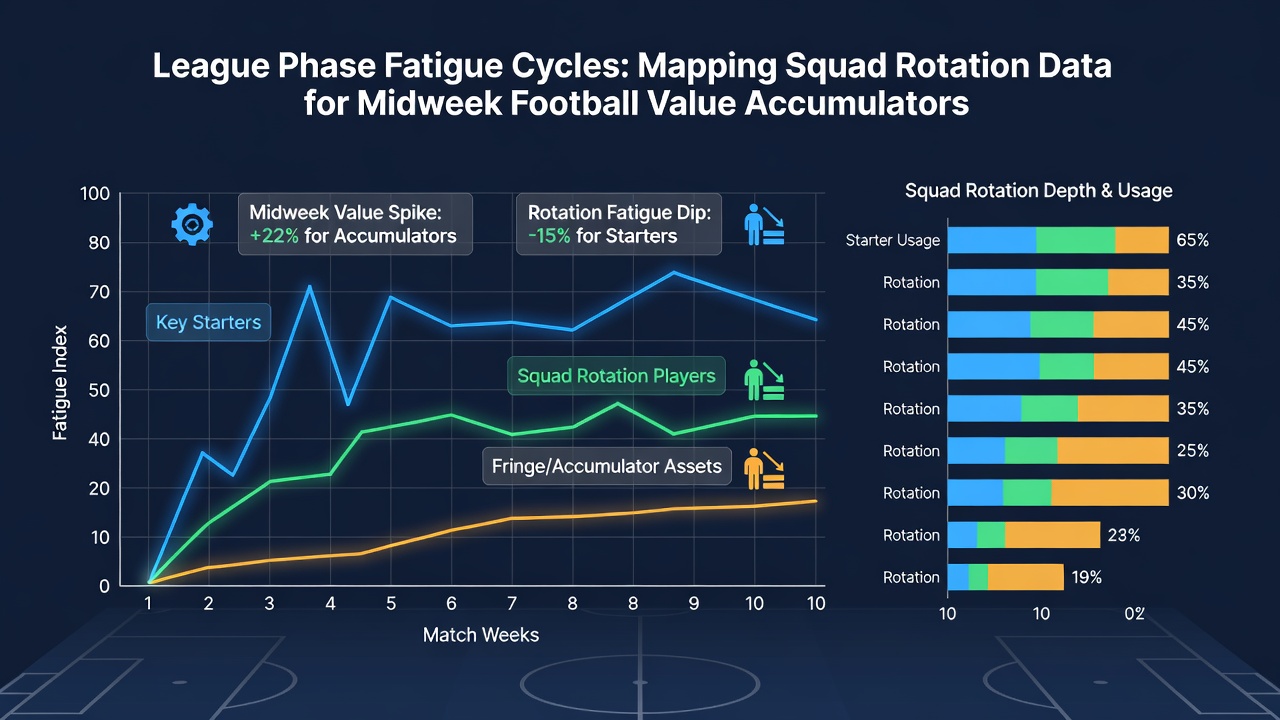
Mapping tools integrate this information into visual timelines that flag periods of elevated fatigue risk such as the run of games between Matchday 4 and Matchday 6 in the Champions League phase. Teams showing consistent rotation in these windows demonstrate lower rates of late-game concessions according to aggregated performance statistics and this pattern holds across multiple seasons without significant deviation.
Impact on Accumulator Value Construction
Accumulator builders incorporate rotation data by prioritizing selections from squads that demonstrate disciplined rest cycles and this approach narrows variance in predicted results. For instance clubs that rotate at least three positions after European away trips post stronger home win percentages in the subsequent league round and statistical models built on 2025 data quantify this edge at approximately 8 to 12 percent above baseline expectations. The reality is that ignoring these cycles leads to overexposure on fatigued lineups which historically underperform against rested opponents.
June 2026 marks the conclusion of the 2025/26 campaign where final league phase data sets become available for retrospective analysis and early indicators suggest rotation discipline contributed to title race outcomes in several domestic competitions. Observers tracking these metrics point to specific clubs in the Premier League and Bundesliga that leveraged midweek squad management to secure vital points in the closing months.
Case Examples from Recent Seasons
One club in Serie A rotated its attacking midfield duo during a congested November period and the rested players delivered above-average creative outputs in three consecutive league fixtures while the team maintained an unbeaten streak. Another example from Ligue 1 shows a side that maintained near-identical lineups across midweek and weekend games and suffered measurable drops in high-intensity running metrics tracked by league-wide data providers. These instances illustrate how rotation mapping identifies value opportunities in accumulator lines focused on clean sheets or over/under totals rather than relying solely on raw form guides.
Travel distance compounds fatigue effects and data from Australian sports institutes studying similar scheduling issues in the A-League confirms that long-haul trips followed by quick turnarounds amplify rotation benefits when implemented correctly. European clubs facing comparable intra-week travel now apply these lessons with measurable consistency in their selection patterns.
Conclusion
League phase fatigue cycles provide a structured framework for interpreting squad rotation data and this information feeds directly into accumulator construction by highlighting teams positioned for optimal performance windows. Continued aggregation of match logs through the 2025/26 season and beyond will refine these models as more granular recovery metrics enter public datasets and clubs adapt their strategies accordingly.