NBA Back-to-Backs and Point Spread Patterns Across Recent Seasons
Leon Ludwig · Aug 27, 2026
NBA Back-to-Backs and Point Spread Patterns Across Recent Seasons
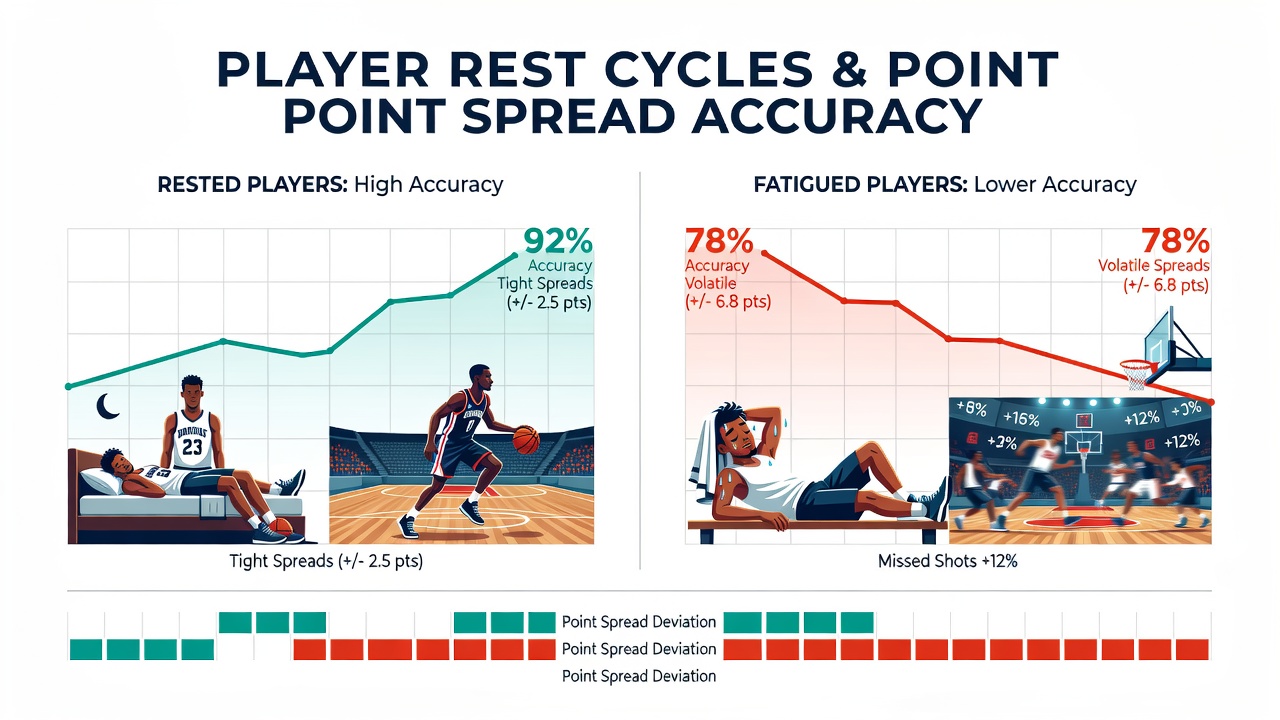
Professional basketball schedules pack in back-to-back games and condensed travel stretches that force teams into varying rest cycles, and these patterns produce measurable shifts in how point spreads resolve over a season. Data from league tracking systems shows squads with zero days of rest win at lower rates than those entering contests after two or more recovery days, yet betting lines adjust only gradually to the same information. Observers note the gap between actual outcomes and closing spreads narrows when analysts incorporate rest metrics more precisely into their models.
Schedule Density and Recovery Metrics
The NBA calendar creates clusters of games that limit recovery time for many clubs, especially during the winter months when travel compounds fatigue. League records indicate teams play between 12 and 18 back-to-backs each season, with some road-heavy stretches leaving starters on the floor for consecutive nights without a full practice day. Researchers tracking player load through wearable devices report average minutes played drop and turnover rates rise when the interval between games falls below 24 hours. Those who studied the 2024-2025 campaign found defensive rating declines by roughly four points per 100 possessions on zero-rest nights compared with three-rest equivalents.
Point Spread Movement and Market Response
Betting markets open with spreads that reflect season-long team strength, then adjust as injury reports and rest announcements surface closer to tip-off. Lines for heavily rested home favorites tend to move toward the home side once the public recognizes the rest edge, yet away teams on short rest sometimes see inflated totals that fail to account for slower pace. Figures from sports data providers reveal that spreads covering at a 52 percent rate overall shift to 57 percent for favorites entering with at least two days off when the opponent arrives on zero rest. This differential holds across both conference and non-conference matchups.
Performance Indicators Tied to Rest
Shooting efficiency, rebounding margins, and assist-to-turnover ratios all correlate with days between games. Three-point percentage for teams on one day of rest averages 1.8 points higher than zero-rest outings according to play-by-play archives, while second-chance points allowed increase when big men log heavy minutes on consecutive nights. One study of Western Conference clubs during the 2025 portion of the schedule showed bench production rises measurably after a scheduled day off, narrowing the gap between starters and reserves and stabilizing team output late in games. These shifts influence the final margin more than raw talent differentials alone would predict.
Regional and Seasonal Variations
Coastal franchises with shorter flights experience slightly smaller rest penalties than Midwest or mountain teams forced across multiple time zones, data from travel logs confirm. August 2026 schedule releases already highlight early-season back-to-backs for several Eastern Conference clubs that open with road trips, setting up potential early edges once the numbers settle. European and Australian basketball leagues, operating under different calendars, provide comparative cases where fewer back-to-backs produce tighter spread accuracy overall; analysts cross-reference those datasets when projecting NBA margins.
Load Management and Lineup Adjustments
Coaches increasingly rest star players on the second night of back-to-backs, altering rotation depth and changing the effective strength of the lineup that reaches the floor. Official NBA injury reports and lineup submissions show an uptick in such decisions since 2023, and spread accuracy improves when oddsmakers incorporate probable minutes restrictions rather than assuming full-strength rosters. Teams that manage minutes proactively maintain higher fourth-quarter efficiency even after heavy travel, whereas clubs that play starters heavy minutes see late-game breakdowns that exceed spread projections. External data from the NBA official statistics portal tracks these minute distributions game by game.
Long-Term Trends and Predictive Models
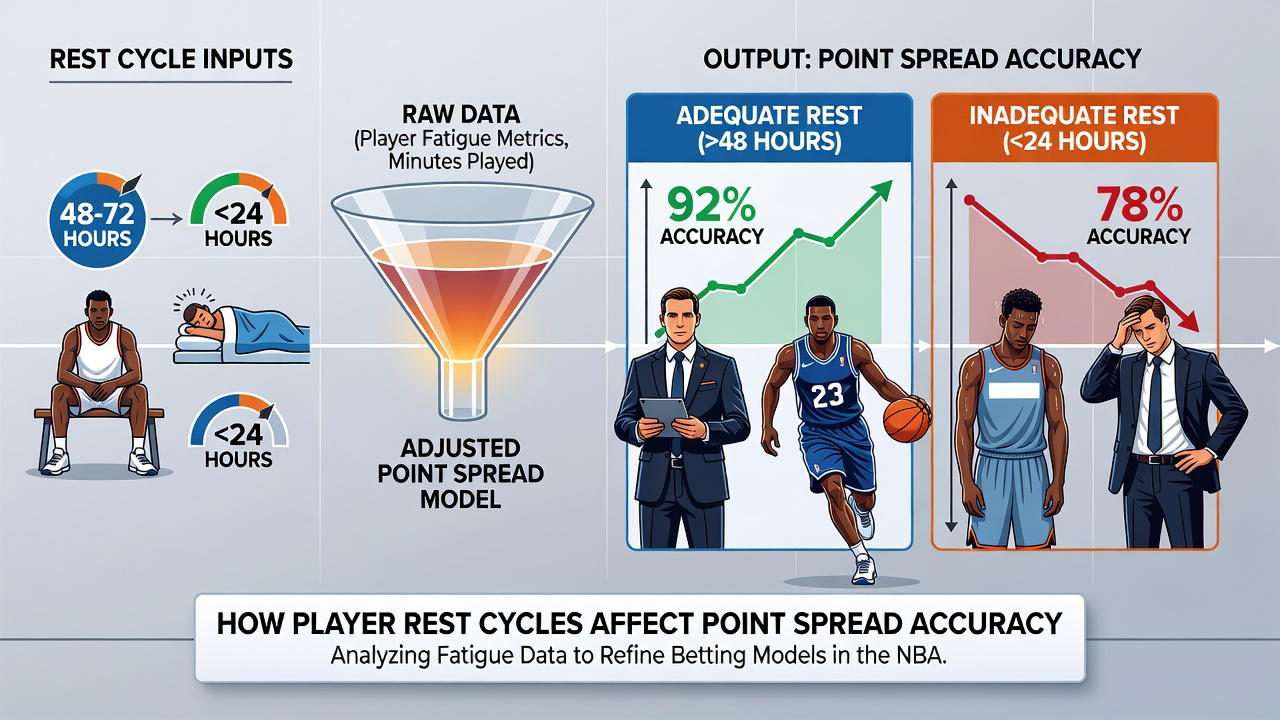
Regression models that add rest differential as an independent variable reduce mean absolute error in margin predictions by 0.8 points compared with models relying solely on season averages. Academic papers from sports analytics conferences document similar improvements when machine-learning approaches weight recent rest cycles more heavily than older performance data. The 2025-2026 season introduced expanded rest-tracking dashboards available to media and bettors alike, increasing transparency around the variable and accelerating line adjustments. Yet residual edges persist in lower-profile games where public attention remains limited.
Conclusion
Rest cycles shape both on-court execution and the accuracy of point spreads in professional basketball through measurable changes in efficiency, pace, and lineup composition. League data and academic reviews continue to refine how these factors integrate into predictive frameworks, while schedule releases and load-management trends supply ongoing inputs for updated models. The interplay remains dynamic as teams adapt strategies and markets incorporate new information sources each season.