NBA Defensive Efficiency: Constructing Winning Parlays from Key Metrics
Zara Sullivan · Jul 25, 2026
NBA Defensive Efficiency: Constructing Winning Parlays from Key Metrics
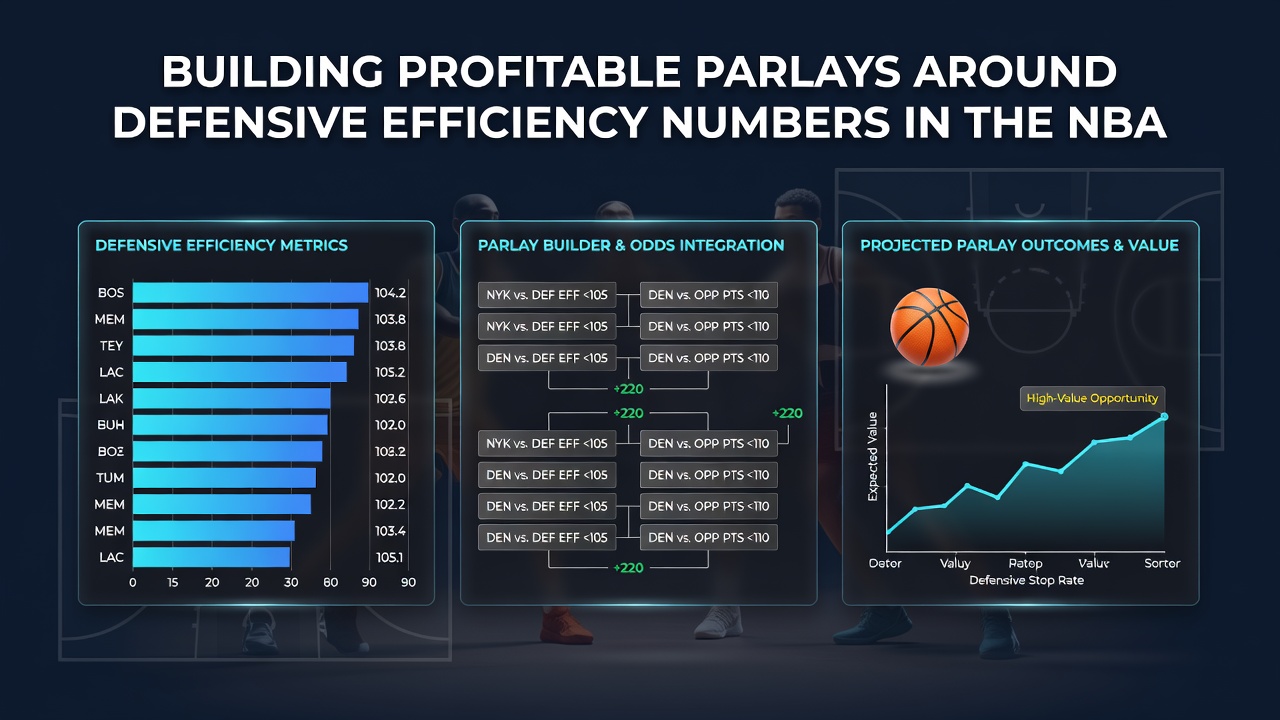
Defensive efficiency metrics form the backbone of many NBA betting strategies, and observers note that teams with strong defensive ratings often create predictable outcomes in player props and team totals. Data from recent seasons shows that squads holding opponents below 105 points per game tend to produce lower scoring environments, which analysts factor into parlay selections involving under totals and limited player points. Researchers at academic institutions have examined these patterns across multiple campaigns, revealing consistent correlations between defensive efficiency and reduced offensive outputs from visiting teams.
Core Defensive Metrics and Their Applications
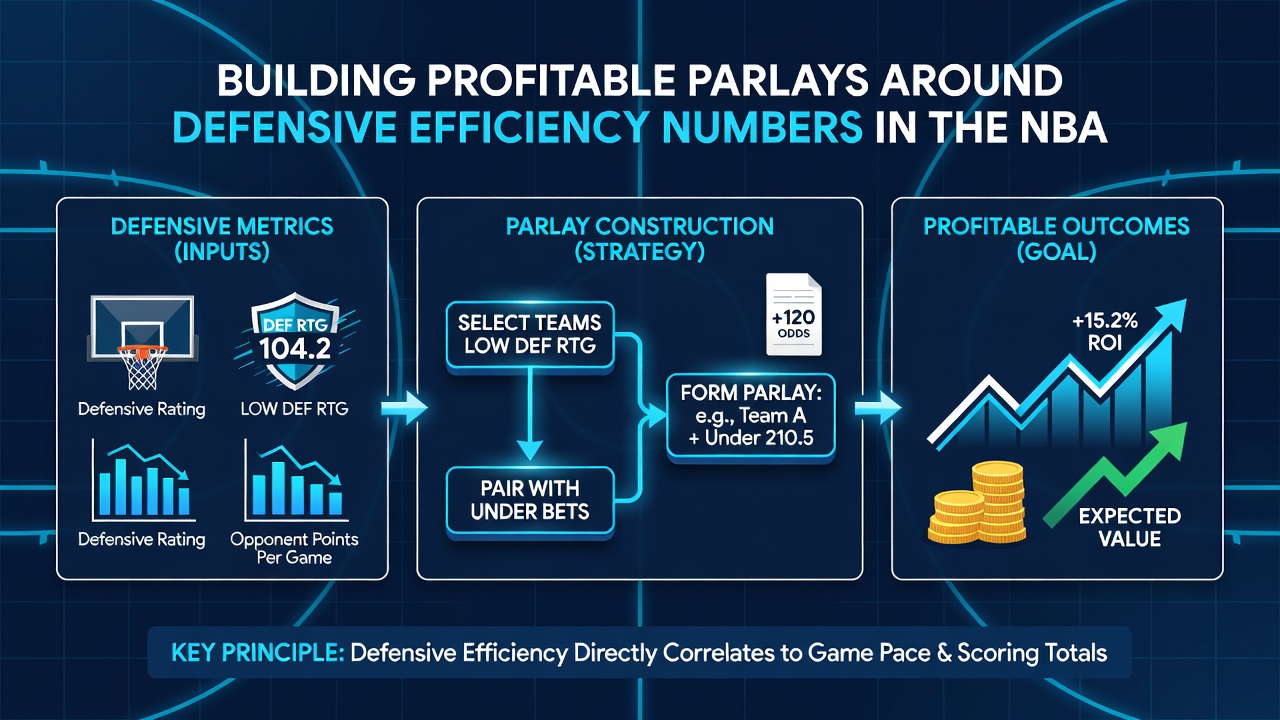
Defensive rating, calculated as points allowed per 100 possessions, stands as one central figure that bettors track through official league sources. Teams posting defensive ratings under 110 frequently limit star players to below their season averages, and this trend allows for parlay combinations around player points unders when paired with opponent matchups. Steal and block rates add another layer, since elevated numbers in these categories disrupt offensive flow and lead to fewer fast-break opportunities. Studies indicate that clubs ranking in the top 10 for blocks per game see measurable drops in opponent field goal percentages inside the paint.
Building Multi-Leg Parlays with Efficiency Data
Constructing parlays requires matching defensive strengths against specific offensive weaknesses, and those who've analyzed historical box scores find success when combining team defensive efficiency with individual usage rates. For instance, a matchup against a high-paced offense facing a top-tier defense often yields value on under points for multiple players, while the same defensive unit against a slow-paced team might support over totals on rebounds. Data shows that incorporating pace-adjusted defensive efficiency helps refine these selections, since raw points allowed can mislead without context from possessions per game.
Load management situations in July 2026 further influence these builds, as teams rest key defenders ahead of the new season and create shifts in efficiency rankings. Bettors monitor preseason reports to adjust parlay legs accordingly, pairing altered defensive units with corresponding player prop overs or unders.
Case Examples from Recent Seasons
One study from university researchers tracked defensive efficiency across Eastern Conference matchups and found that teams with elite paint protection reduced opponent second-chance points by significant margins. This pattern translated into parlay value when combined with rebounding props for opposing big men falling short of averages. Another dataset revealed that perimeter defensive efficiency, measured through opponent three-point percentages, created edges in legs involving shooting guard points and assists.
Industry reports from sports analytics organizations highlight how defensive turnover rates interact with fast-paced offenses to produce over/under results that align across multiple games in a single slate. People who've reviewed these reports note the benefit of cross-referencing defensive efficiency with travel schedules, since back-to-back games often amplify defensive lapses and open opportunities for adjusted parlay structures.
Integrating External Data Sources
According to findings published by academic research groups focused on sports performance, defensive efficiency trends hold predictive power when isolated from offensive variables. National Institutes of Health studies on athletic metrics provide supporting context for how physical demands affect defensive outputs over extended schedules. Canadian gaming authorities have also released industry summaries that connect betting market movements to statistical models incorporating defensive ratings, offering additional layers for parlay construction without relying on single-region perspectives.
Rotation changes announced during the 2026 offseason further modify these efficiency numbers, and observers track injury reports alongside defensive lineup data to refine selections. Teams integrating new defensive schemes show temporary dips in efficiency that create short-term betting alignments across correlated player props.
Conclusion
Defensive efficiency numbers supply measurable inputs for NBA parlay construction when combined with pace, usage, and schedule factors. Research indicates that consistent application of these metrics across multiple legs yields structured approaches grounded in available data, while July 2026 developments around roster adjustments continue to shape the landscape for upcoming campaigns.