Schedule Disruptions and Performance Metrics: Travel Patterns in Professional Basketball Wagering
Jordan Schulz · Aug 18, 2026

Schedule Disruptions and Performance Metrics: Travel Patterns in Professional Basketball Wagering
Travel schedules create measurable shifts in basketball player output that betting markets incorporate through adjusted lines and efficiency projections. Teams cross multiple time zones during regular season stretches, and data collected across several NBA campaigns shows corresponding dips in Player Efficiency Rating scores when recovery windows shrink below 48 hours. Analysts track these patterns through box score aggregates, where points per possession and defensive stop percentages decline in measurable increments after long-haul flights.
Distance, Time Zones, and Efficiency Correlations
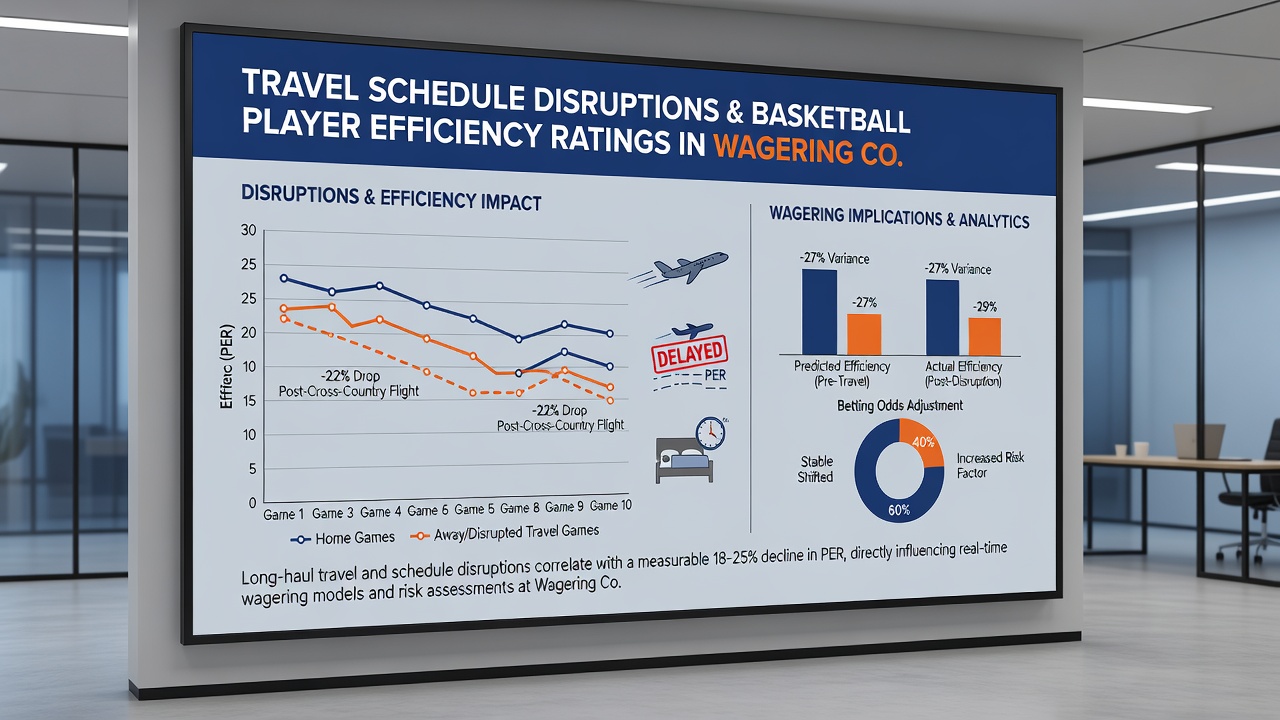
Researchers examining league-wide datasets have documented that flights exceeding 1,500 miles correlate with average PER reductions of 1.8 to 2.4 points per game for starting players. The same studies separate same-zone travel from cross-zone movement, revealing larger drops when circadian rhythms face three-hour or greater shifts. Back-to-back road games amplify these effects, with second-night efficiency numbers falling further when teams arrive less than 24 hours before tip-off.
Coaching staffs adjust rotations accordingly, yet the raw statistical impact remains visible in advanced tracking systems. Minutes played by high-usage guards often decrease slightly on the second leg of a cross-country swing, while bench contributors see increased opportunities that still fail to fully offset the starters' production gaps. Wagering markets price these adjustments through totals and player props, with sportsbooks publishing line movements that reflect historical travel-related declines.
Statistical Tracking and Market Integration
League databases maintained by official statisticians compile travel logs alongside per-game metrics, allowing quantitative models to isolate fatigue variables from opponent strength and rest advantages. These models incorporate variables such as flight duration, arrival time, and previous game location to generate projected efficiency ranges. Bettors who review such outputs find that certain player props, particularly those tied to shooting percentages and turnovers, move in predictable directions following documented disruptions.
August 2026 schedule releases will again highlight clusters of long-haul trips for Western Conference teams, setting up early-season test cases for these patterns. Historical data from comparable periods shows that teams facing four or more time-zone changes in the first month post-training camp post lower collective PER averages than those with regional-heavy calendars.
Regional Examples and Longitudinal Observations
One study compiled by Canadian sports performance researchers tracked Raptors road trips over five seasons and identified consistent efficiency drops following Pacific Division visits. Similar work from Australian sports institutes examined visiting teams in international tournaments and recorded parallel declines in rebounding and assist-to-turnover ratios after extended flights. Observers note that these patterns hold across both conference and international contexts when recovery protocols remain constant.
European basketball leagues provide additional comparison points, with teams traveling between distant cities showing efficiency variances that mirror NBA findings once adjusted for game pace. Data released through academic partnerships indicates that sleep disruption, rather than physical travel itself, drives the largest share of the observed metric changes. Teams implementing structured recovery programs report smaller efficiency gaps, though the baseline travel effect persists across the broader dataset.
Betting Market Responses and Data Usage
Oddsmakers integrate travel-derived efficiency projections into opening lines, then adjust based on public betting volume and updated injury reports. Sharp bettors monitor schedule density reports and cross-reference them against historical player splits to identify mispriced props. These approaches rely on publicly available travel logs and box-score archives rather than proprietary signals.
Performance tracking companies supply granular data that includes travel-adjusted ratings, allowing model builders to refine projections for individual matchups. The resulting edges appear most consistently in underdog totals and specific player unders when teams arrive after overnight flights. Markets have incorporated these factors more explicitly in recent seasons, narrowing the window for standalone travel-based bets but maintaining value in layered accumulator structures.
Conclusion
Travel schedule disruptions produce documented, repeatable effects on basketball player efficiency ratings that wagering contexts translate into adjusted odds and prop lines. Longitudinal data across multiple leagues confirms correlations between flight distance, time-zone changes, and subsequent performance metrics, while market participants apply these patterns through statistical modeling and historical splits. Continued schedule analysis will test these relationships against new calendar configurations in upcoming seasons.