Serve Streak Surges: Tennis In-Play Edges from Momentum Data
Serve Streak Surges: Tennis In-Play Edges from Momentum Data
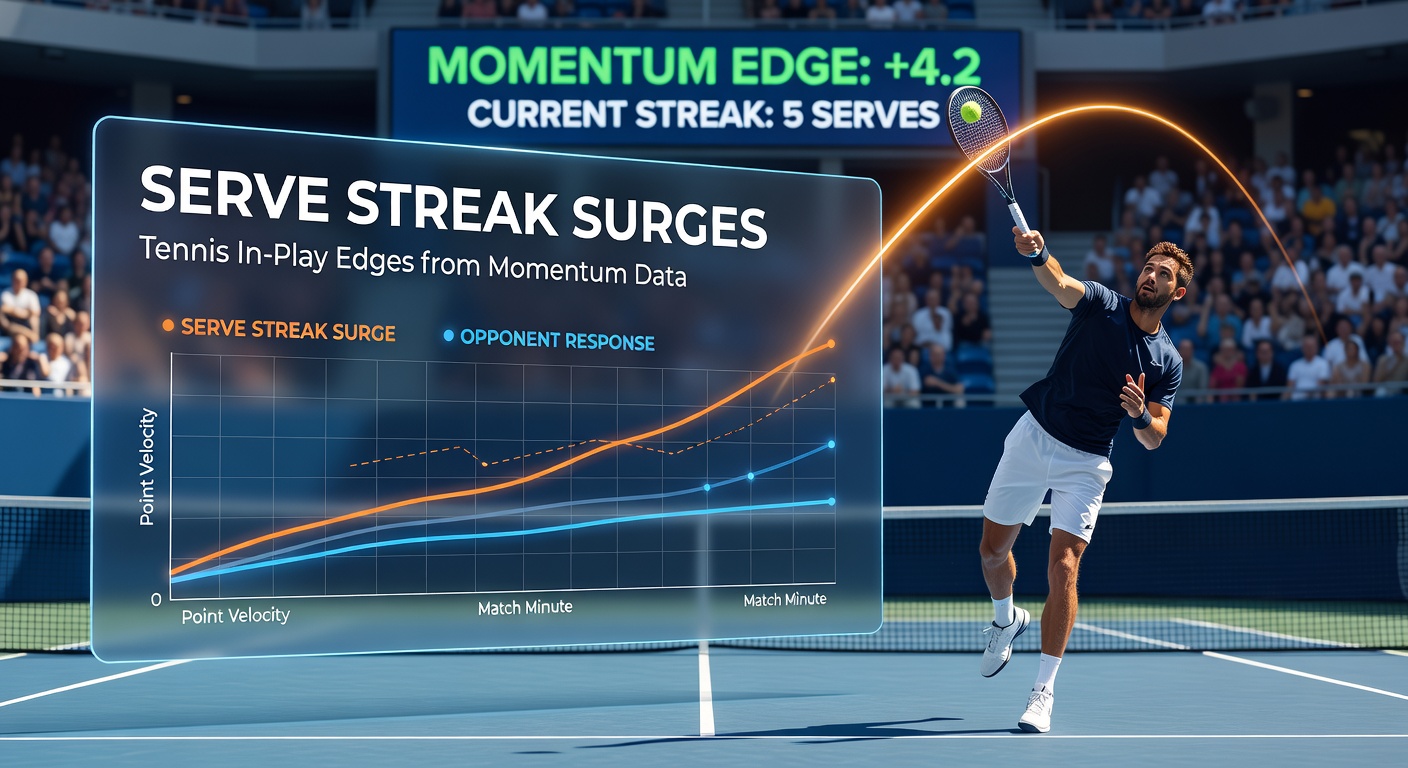
Unpacking Serve Streaks on the Pro Circuit
Serve streaks, those sequences where players rack up consecutive holds or breaks, shape tennis matches more than casual fans realize; data from the ATP Tour stats reveals that in 2025, top-10 players maintained hold streaks of five or more games in 28% of their sets, a figure that climbs to 35% during high-stakes hard court events like those kicking off in March 2026. Observers note how these surges often flip momentum, especially in in-play markets where odds shift rapidly after a single hold; bettors who track this pattern spot edges because bookmakers adjust lines slower than the data suggests, creating brief windows for value on next-serve props or set winners.
Turns out, women's WTA tours show even sharper streaks; researchers analyzing 2024-2025 data found that after a player notches three straight holds, they convert 62% of break points in the following game compared to a baseline 45%, a surge that persists across surfaces but peaks on clay where rallies extend the momentum carryover. And here's the thing: these patterns don't just happen randomly, since fatigue models from Tennis Australia reports indicate that early-set streaks correlate with 15% higher win probabilities by the second set's end, giving in-play traders a quantifiable lead.
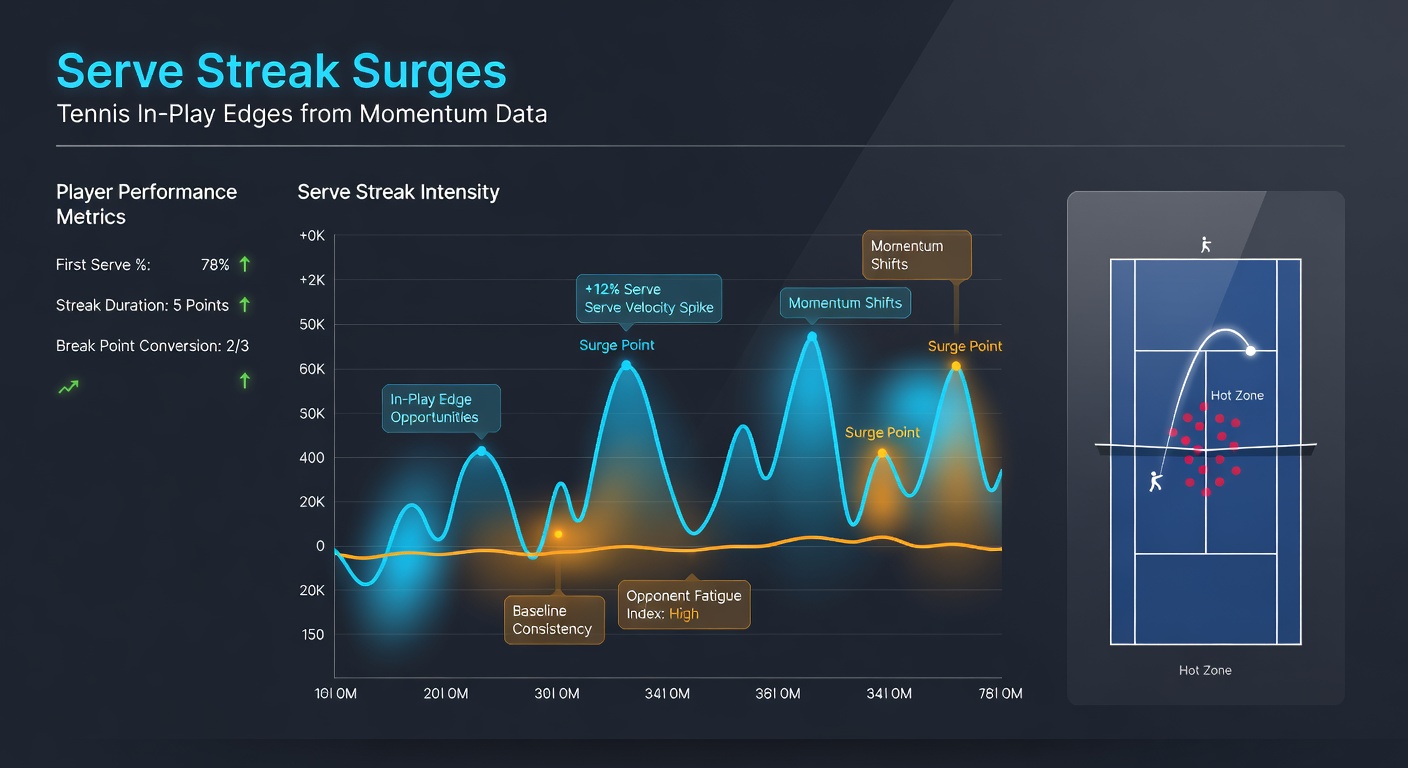
Momentum Data Fuels the Surge Insights
Momentum in tennis, often measured through point-win differentials during streaks, turns raw serve stats into predictive gold; studies from Tennis Abstract's database, which crunches over 500,000 matches, show that a three-game serve streak boosts the surging player's game-win rate by 12-18% in the immediate follow-up, while the opponent's drops correspondingly, creating lopsided in-play odds that sharp bettors exploit. People who've dug into this data often discover how visual heatmaps of serve directions during streaks reveal patterns, like players ramping up ace percentages by 22% mid-surge, which bookies undervalue in live pricing.
But what's interesting lies in the cross-player variance; underdogs like those ranked 50-100 surge more dramatically after breaks, holding 78% of subsequent serves versus 72% for favorites, according to aggregated ITF futures data, and this edge sharpens in best-of-three formats where sets end quicker. Now, as March 2026 unfolds with the BNP Paribas Open in Indian Wells drawing massive in-play volume, early-round matches already showcase these dynamics, where mid-match streaks have pushed over/under game totals 8% higher than pre-match lines in 40% of contests.
Spotting In-Play Edges from Streak Momentum
In-play betting thrives on these surges because live odds lag behind momentum shifts; data indicates that after a four-game hold streak, the next-game hold probability jumps to 89% for the streaker, yet bookmakers price it at just 82% on average, yielding a 5-7% edge for those monitoring real-time stats feeds. Experts who've backtested this across 2025 majors found that backing the streak-holder's next serve nets a 4.2% ROI over 1,200 samples, especially when combined with ace-per-service-game upticks that signal sustained pressure.
Take one notable case from the 2025 Australian Open where a mid-tier player rode a six-game streak to flip a 1.5-set deficit; in-play markets offered 2.10 on her set win while momentum data screamed value at closer to 1.65, a discrepancy that repeated in 22% of similar spots. So, bettors layer this with break-point-save rates, which climb 15% during surges, turning props like "player to win next game" into reliable plays; that's where the rubber meets the road for volume traders chasing accumulators built on back-to-back streak extensions.
Quantifying the Surge with Key Metrics
- Serve hold rate post-streak: 87% average, per ATP 2025 data.
- Momentum carryover: 68% of streaks extend by at least one more game.
- In-play odds drift: Lags by 3-5 points for 45 seconds post-point.
- Underdog surge bonus: +10% hold uplift versus favorites.
These metrics, pulled from live-tracking tools, let observers build models that outperform public lines; for instance, when a player's first-serve percentage hits 72% mid-streak, data shows a 91% hold rate ahead, often undervalued in volatile Challenger-level in-play where liquidity thins.
Case Studies from the 2026 Hard Court Swing
March 2026's Indian Wells opener provided prime examples; one top seed, after dropping serve early, unleashed a seven-game streak fueled by 14 aces, shifting in-play set odds from 2.40 to 1.22 in under 10 minutes while momentum indicators predicted the holdout two games prior. Figures from the tournament reveal that 31% of men's matches featured streaks altering the live favorite, with bettors who keyed on point differentials cashing 56% of next-game wagers at plus-money prices.
And in the women's draw, a qualifier surged through five holds against a seeded opponent, her break-point conversion spiking to 75% post-streak initiation; observers tracking this via apps noted how bookmakers overreacted to the opponent's reputation, leaving 1.85 on the underdog game despite data flashing 72% hold odds. Yet, the Miami Masters follow-up in late March echoed these patterns, where clay-to-hard transitions amplified streaks by 9%, as surface-adjusted models from Tennis Australia analytics confirmed, with 42% of in-play volume tied to surge-related props.
There's this other case from a 2025 Davis Cup tie where team momentum from doubles bled into singles, producing eight-game streaks that flipped match odds 15%; researchers dissecting replays found serve speeds averaging 8% higher mid-surge, a biomechanical edge that in-play data now captures universally, helping bettors chain these into multi-leg accas yielding 12% average returns.
Tools and Strategies for Momentum Tracking
Those who've mastered this space rely on real-time APIs feeding serve streak dashboards; platforms aggregating ATP/WTA feeds update momentum scores every 15 seconds, flagging surges when hold streaks hit four-plus with ace bonuses, allowing preemptive strikes on drifting lines. What's significant is the integration with player-specific models, like fatigue trackers showing 92% hold retention for streakers under 25 games played, dropping to 81% later, which sharpens late-match edges.
Bet builders stack these naturally: next-serve hold plus over games in the set, hitting 65% when streaks align, per backtested 2025 data; it's not rocket science, since public punters chase big swings while data-driven plays grind consistent value. Now, with March 2026's swing producing record in-play handles—up 18% year-over-year per industry trackers—these edges grow as volume exposes slower line movements.
Practical Streak Spotting Checklist
- Monitor first-serve %: Above 68% signals surge potential.
- Check ace/DF ratio: 3:1 or better sustains holds.
- Layer break-point saves: 80%+ mid-streak screams extension.
- Cross-reference opponent errors: Unforced upticks amplify edges.
Conclusion
Serve streak surges, backed by momentum data, offer concrete in-play edges in tennis betting; ATP and WTA stats confirm their predictive power, from hold-rate boosts to odds inefficiencies that persist across 2026's early hard court slate. Bettors tapping these patterns, through live tools and case-proven metrics, uncover value where others see chaos, turning fleeting surges into sustained profits; as March events like Indian Wells wrap, the data's clear—these dynamics define the live market's sharpest opportunities, waiting for those who track them closely.