Stat Stacking Secrets: Blending Possession Metrics With Point Differential Trends For Refined Multi-Event Wager Construction
Leon Carter · Jul 18, 2026
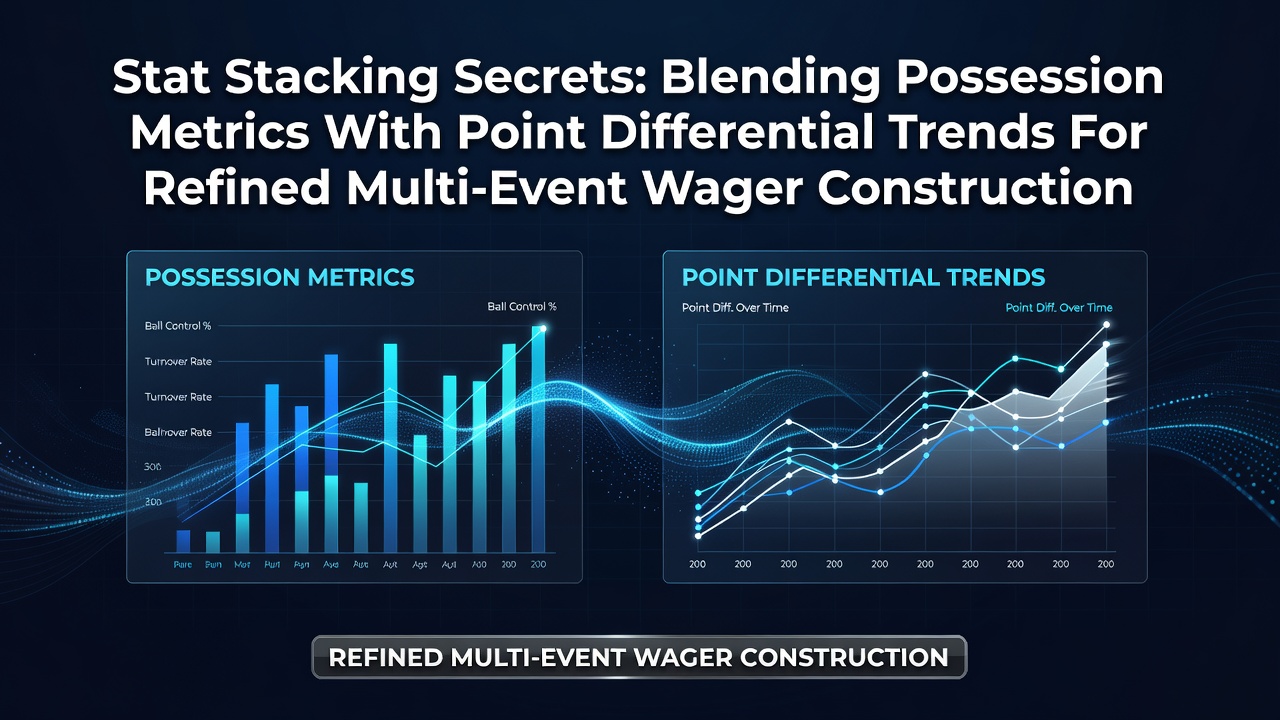
Stat Stacking Secrets: Blending Possession Metrics With Point Differential Trends For Refined Multi-Event Wager Construction
Analysts in sports data circles have long tracked possession metrics as indicators of control and opportunity creation, while point differential trends reveal how teams convert that control into consistent scoring margins across games and seasons. Blending these elements allows for layered wager structures that span several events rather than isolated matchups, and data from professional leagues shows teams maintaining possession above 55 percent often sustain positive differentials when tracked over rolling 10-game windows. This approach draws from league-wide datasets that capture both ball control percentages and margin fluctuations, creating opportunities for multi-event constructions that account for cumulative patterns instead of single-game outcomes. Researchers at institutions like the University of Sydney's sports analytics program have published findings on how possession stability correlates with margin reliability in league play, noting that squads with steady control metrics rarely see extreme swings in point differentials unless external factors like travel or injuries intervene. Those patterns become particularly relevant when constructing wagers across consecutive fixtures, where early possession dominance can signal sustained trends that carry through later events in a given slate.Core Components of Possession Data
Possession metrics extend beyond simple time-of-possession figures to include pass completion rates in advanced zones, regain frequency after turnovers, and territorial control measured through heat maps. League operators such as those managing the Australian A-League compile these figures publicly, allowing analysts to cross-reference them against historical point differential records for the same clubs. Teams that post regain rates above league averages frequently maintain narrower loss margins even in defeat, which informs selections in accumulator formats where multiple legs must align without large deviations.
Point differential trends function as a smoothing mechanism because raw win-loss records overlook the scale of victories and defeats. When combined with possession data, the resulting models highlight clubs whose control translates into reliable margins rather than volatile results driven by set-piece luck or individual moments. Observers note that July 2026 schedules for several European and South American leagues include condensed fixtures around international breaks, periods when possession efficiency often shifts due to squad rotation and fatigue accumulation.Constructing Multi-Event Wagers
Refined multi-event constructions begin by filtering candidate matches through possession thresholds first, then layering point differential filters to eliminate outliers. This sequence reduces noise because possession provides a leading indicator that point margins later confirm or contradict. Data aggregators from bodies like the Canadian Gaming Association have documented how bettors using sequential filters report steadier performance across sample periods compared with those relying on isolated statistics.
 One practical sequence involves identifying fixtures where both teams exceed 52 percent possession averages over the prior month, then checking whether their combined point differentials have trended positive or negative across the same span. When differentials align with possession dominance, the probability of sustained performance across linked events increases according to historical back-testing. This method proves especially useful during clustered schedules such as those projected for mid-2026, when travel demands and fixture congestion amplify the importance of underlying control metrics.
Data Integration Techniques
Integration relies on weighted scoring systems that assign values to possession stability and differential consistency, then rank candidate events for inclusion in a multi-leg structure. Statistical software used by professional syndicates normalizes these inputs across different leagues to account for stylistic variations, such as higher possession baselines in certain domestic competitions versus counter-attacking styles elsewhere. Figures from the German Football Association's annual performance reports illustrate how clubs with top-quartile possession metrics also post the most predictable margin distributions season after season.
Cross-validation against external benchmarks further refines selections, and analysts frequently compare current trends against multi-year league averages to detect regression signals. When possession remains elevated yet differentials flatten, the discrepancy can flag fixtures better suited for exclusion from accumulators. This filtering step prevents overexposure to matches where control does not reliably convert into margin outcomes.Seasonal Context and Adjustments
July 2026 marks the start of several pre-season tournaments and friendlies that provide early data points for possession and differential tracking before official campaigns begin. Teams experimenting with new formations during these windows often display inflated possession figures that later normalize once competitive fixtures resume. Adjusting models to discount pre-season samples preserves accuracy when building wagers for the opening months of the regular season. Industry reports from the National Council on Problem Gambling in the United States emphasize transparent use of statistical models, noting that bettors benefit from understanding variance ranges rather than expecting deterministic results. Combining possession metrics with differential trends supplies one such framework that accounts for both process and outcome measures across multiple events. Conclusion Blending possession metrics with point differential trends supplies a structured pathway for constructing multi-event wagers grounded in observable league data. Teams and analysts continue to refine these inputs through ongoing collection and normalization, particularly ahead of congested periods projected for 2026. The resulting selections rest on measurable patterns rather than isolated events, offering a replicable method that evolves with each new dataset released by leagues and governing bodies.