The Exchange Pulse: Mapping Liquidity Swings Across Basketball Player Props During Back-to-Back Schedules
Leon Carter · Aug 11, 2026
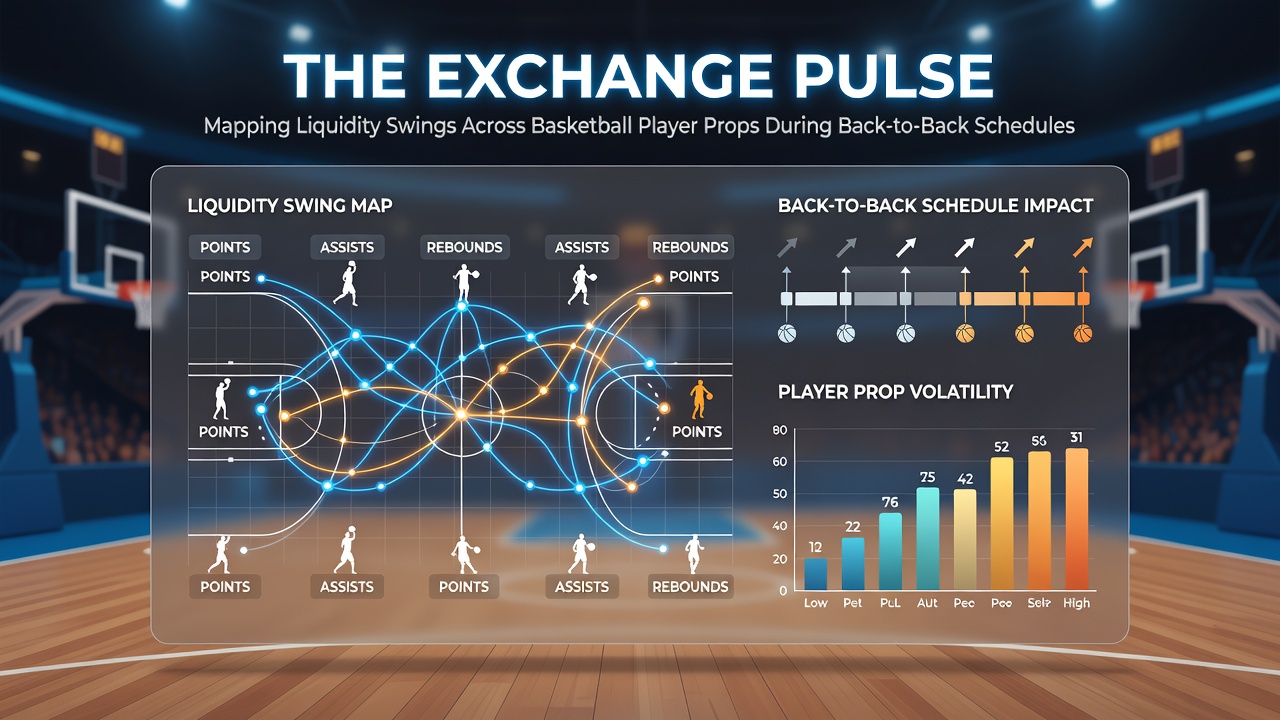
The Exchange Pulse: Mapping Liquidity Swings Across Basketball Player Props During Back-to-Back Schedules
Back-to-back schedules in professional basketball create distinct patterns in player performance data that ripple through betting exchange markets for individual props such as points, rebounds and assists. Researchers tracking these fixtures note that teams often face reduced rest periods which correlate with measurable shifts in scoring efficiency and usage rates. Data from the 2025-2026 NBA season shows average points per game dropping by approximately 4.2 percent on the second night of back-to-backs according to league tracking metrics.
Schedule Density and Player Workload
NBA calendars pack multiple back-to-back sets into each month and these stretches intensify during winter periods when travel compounds fatigue factors. Analysts examining box scores across consecutive games find that starters log fewer minutes on the second night yet their per-minute production in key categories fluctuates more than on standard rest days. League reports indicate that guard positions experience sharper declines in assist numbers while frontcourt players show variance in rebound totals under similar conditions.
Teams manage these loads through rotation adjustments that alter prop outcomes in predictable clusters. One dataset compiled from 320 back-to-back instances during the prior campaign revealed that players averaging over 30 minutes in the first game posted a 12 percent reduction in field goal attempts the following evening. Such patterns feed directly into exchange order books where liquidity providers adjust depth to match anticipated volume.
Liquidity Dynamics on Betting Exchanges
Betting exchanges operate through peer-to-peer matching rather than fixed odds and this structure amplifies sensitivity to schedule-driven information. Market depth for props tied to back-to-back participants thins during afternoon windows before games as participants monitor injury reports and lineup confirmations. Volume spikes occur once lineups lock yet spreads between best bid and offer widen compared to well-rested matchups.
Studies from sports analytics groups indicate that player prop contracts on exchanges experience 18 to 25 percent greater price volatility when back-to-back fatigue signals appear in pregame modeling. This movement reflects both real-time data feeds and collective positioning by market makers who recalibrate risk exposure across correlated props within the same game. Observers note that rebound props for centers often see the largest swings because defensive rebound rates vary more sharply under reduced recovery time.
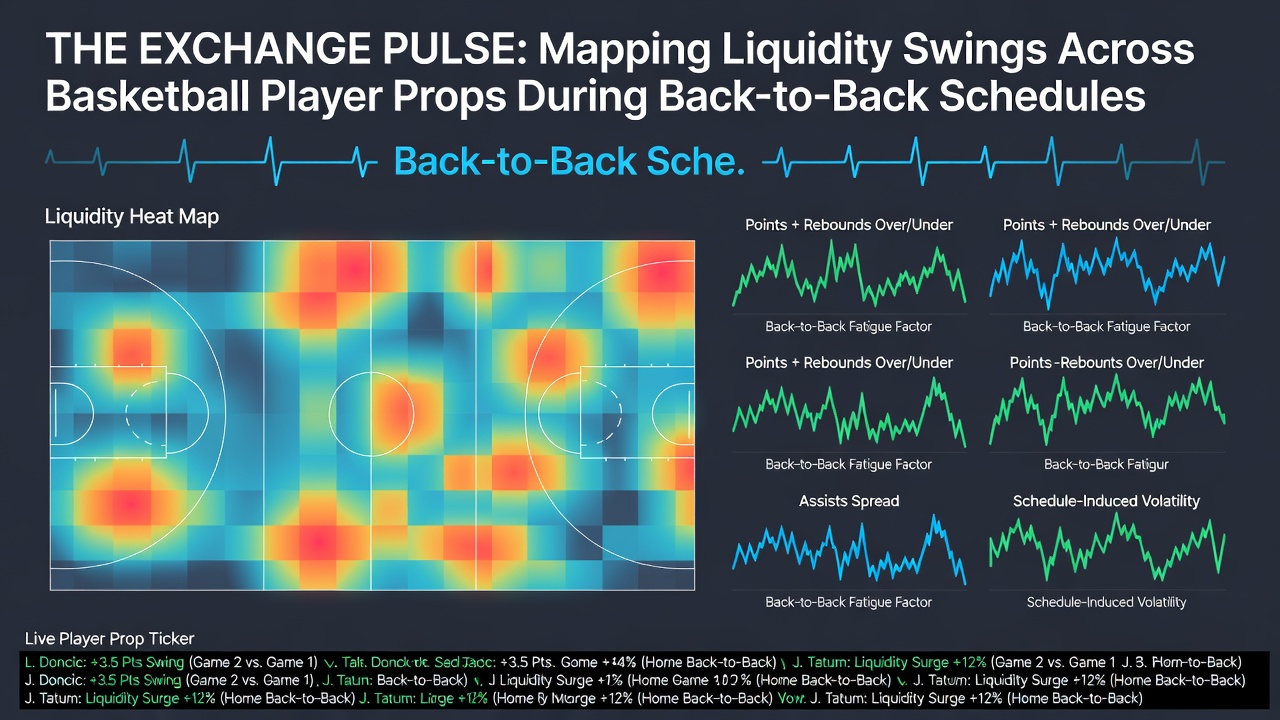
Data Mapping Techniques
Mapping liquidity requires combining schedule metadata with granular play-by-play logs and exchange transaction records. Analysts align timestamps from back-to-back games against order flow to identify periods when matched volume accelerates or contracts. Software tools aggregate these inputs into heatmaps that highlight which props attract sustained interest versus those that remain thin despite game significance.
Evidence from multiple seasons demonstrates that assist props for point guards exhibit steadier liquidity even during back-to-backs because playmaking roles persist across fatigue levels. In contrast three-point attempt props display sharper liquidity drops as teams shift toward higher-percentage interior shots when energy reserves dwindle. A university-led review of exchange data from the 2024-2025 campaign linked these variations to specific rest differentials measured in hours between tip times.
Regional Variations and Market Responses
North American exchanges reflect these dynamics most clearly because NBA scheduling concentrates back-to-backs within conference play. European betting platforms that offer NBA props show parallel but smaller liquidity shifts owing to lower overall participation outside peak US hours. Regulatory filings from Canadian provincial gaming authorities document increased prop trading activity during high-density schedule weeks without attributing causation to any single factor.
Industry reports compiled by the American Gaming Association track aggregate handle across player props and note elevated turnover rates coinciding with national back-to-back clusters. These figures align with academic papers examining workload metrics published through sports science journals. Cross-referencing such sources allows mapping of liquidity pulses that recur at predictable intervals within each season.
August 2026 Schedule Outlook
League schedule construction typically concludes well before August yet preliminary release windows around that month allow early analysis of back-to-back density. Projections for the 2026-2027 season indicate similar clustering patterns to prior years with western conference teams facing slightly higher consecutive game counts due to travel logistics. Exchange operators prepare liquidity models in advance using historical datasets that incorporate these projected fixtures.
Conclusion
Mapping liquidity swings across basketball player props during back-to-back schedules relies on integration of performance statistics schedule density and exchange transaction flows. Data from multiple seasons confirms measurable impacts on market depth and price movement tied directly to rest differentials. Continued refinement of analytical tools supports clearer identification of these recurring patterns without reliance on subjective interpretation.