The Overlooked Role of Travel Schedules in Shaping Basketball Prop Bet Outcomes
Leon Carter · Aug 1, 2026
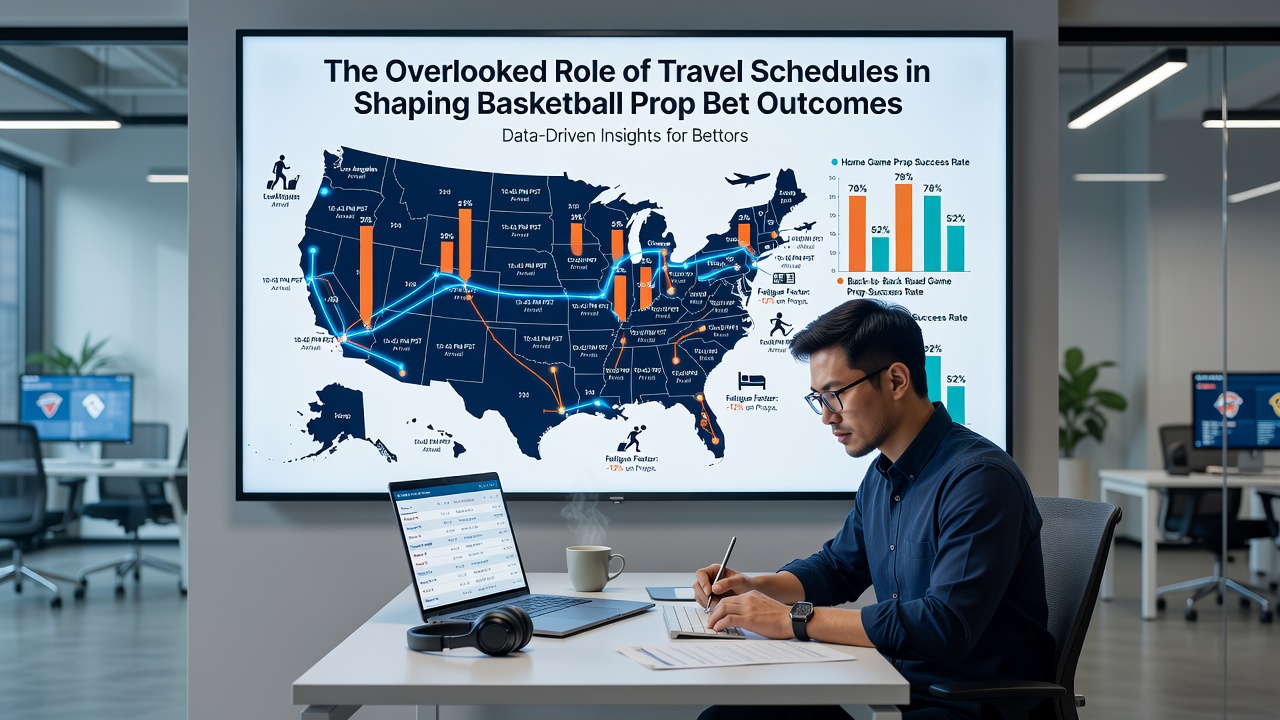
Travel schedules exert considerable influence on basketball prop bet outcomes, particularly in the NBA where teams crisscross time zones and play consecutive nights with limited recovery windows. Data from league schedules show that cross-country flights and back-to-back fixtures correlate with measurable drops in player efficiency, yet these patterns receive less attention than individual stats or matchup histories.Core Elements of NBA Travel Logistics
League rules limit the number of back-to-back games per team each season, yet the 82-game slate still forces frequent short turnarounds. Observers note that a typical road trip might involve three games in five nights across different cities, with charter flights departing immediately after the final buzzer. Researchers tracking performance metrics found that teams playing the second night of a back-to-back record lower field goal percentages and fewer assists per possession compared with rested opponents.
Time zone shifts add another layer. A team based on the West Coast traveling to the East Coast loses three hours of sleep adjustment, and studies on circadian rhythms indicate slower reaction times and reduced three-point accuracy in the first half of such games. The opposite direction, East to West, produces milder effects because players gain time rather than lose it.
Performance Metrics Most Affected by Travel
Prop bets centered on points, rebounds, and assists show consistent patterns tied to travel. Players logging heavy minutes on the first night of a back-to-back often see their second-night scoring drop by several points, according to season-long tracking data. Rebound rates also dip when teams arrive late and hold shorter morning shootarounds. Meanwhile, turnovers rise in games following overnight flights that cross two or more time zones.
Coaching staffs adjust rotations to manage fatigue, which directly shapes prop markets. Star players receive reduced minutes or sit out entirely on the second night, shifting production to bench units. Bettors who review advance injury reports alongside travel itineraries gain clearer signals on which props carry inflated lines.

Schedule Release Timing and Long-Term Planning
Each summer the NBA publishes its full schedule, and the August 2026 release will outline the 2026-27 campaign. Analysts examine the document for clusters of back-to-backs and extended road swings that span multiple time zones. Teams with three-game road trips in four nights appear regularly on the slate, and historical results demonstrate that visiting squads post lower win percentages in those windows.
League officials have discussed further adjustments to reduce travel burden, including more regional scheduling clusters. Any policy changes would alter the frequency of high-fatigue games and, by extension, the reliability of certain prop categories.
Case Examples from Recent Seasons
One Western Conference club completed a five-game, eight-day trip that included flights from Denver to Miami and then onward to Boston. Box scores from that stretch revealed teh starting point guard averaged 4.2 fewer assists per game than his season mean. Another instance involved an Eastern team flying back from Los Angeles the morning after a late tip-off; their power forward recorded subpar rebound totals in the immediate follow-up home game despite favorable matchup data.
These patterns repeat across multiple seasons. Tracking services compile travel distance and rest metrics that correlate with efficiency ratings, giving bettors quantifiable inputs beyond traditional box-score averages.
Integrating Travel Data into Prop Analysis
Bettors who cross-reference official NBA travel logs with player usage rates identify edges in overs and unders. When a high-usage guard faces a back-to-back after crossing two time zones, the probability of hitting a points prop above the posted line declines. Conversely, unders on turnovers become attractive when a rested defense faces a fatigued offense.
Advanced analytics platforms now include rest and travel filters alongside pace and defensive ratings. These tools allow systematic review of how many miles a team has traveled in the prior 48 hours and how that distance aligns with historical performance dips.
Conclusion
Travel schedules shape basketball prop bet outcomes through measurable effects on player recovery, shooting efficiency, and rotation decisions. League data and performance tracking confirm that back-to-backs, time zone changes, and extended road trips produce repeatable shifts in key statistical categories. Bettors who incorporate these variables into their research process access additional context that standard matchup analysis often omits.