Travel Miles and NBA Road Totals: Analyzing Distance Effects on Betting Outcomes
Leon Carter · Aug 20, 2026

Travel Miles and NBA Road Totals: Analyzing Distance Effects on Betting Outcomes
Travel distance plays a measurable role in how NBA road teams perform when totals markets are in focus, and researchers have tracked these patterns across multiple seasons using schedule data and performance metrics. Teams crossing multiple time zones or logging extensive flight hours often show shifts in scoring output that directly influence over and under results, according to aggregated league statistics released by the NBA.
Understanding the Data Behind Travel and Scoring
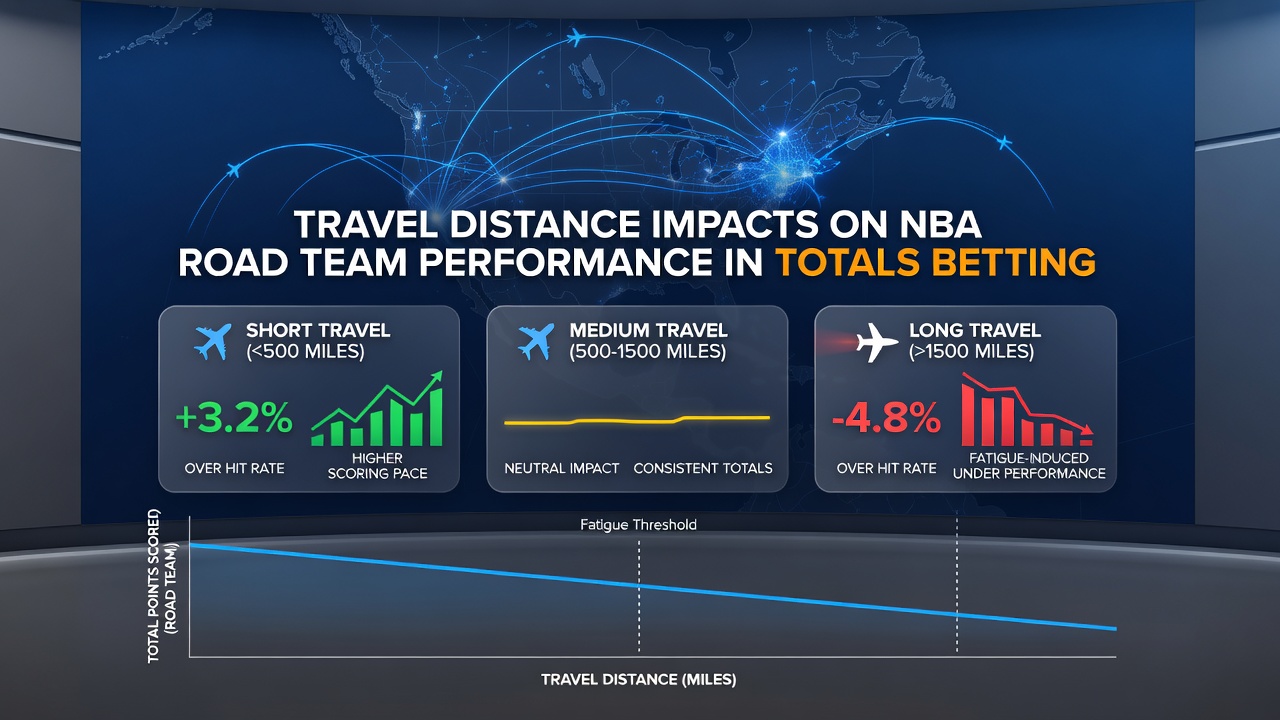
Studies from sports analytics groups indicate that road teams traveling more than 1,500 miles in a single trip tend to see reduced points per game compared with shorter hops under 500 miles, and this pattern holds across both conference and interconference matchups. Observers note that fatigue accumulates not only from the flight itself but also from disrupted sleep cycles and compressed preparation time, factors that data analysts at major research institutions have quantified through regression models applied to box scores. In August 2026 the league released its full regular season schedule with expanded rest guidelines that some teams are already incorporating into load management plans, and early indicators suggest these adjustments may moderate some of the sharper drops previously observed in high-mileage games.
Key Factors That Shape Totals Markets
Back-to-back road games after long flights frequently produce lower combined scores, while teams that arrive two full days early maintain scoring averages closer to their season norms. League-wide figures reveal that when the visiting side has logged over 2,000 miles in the preceding four days the average game total falls by roughly three points, a shift that directly affects bettors focused on over and under lines. Those who study these trends often compare data sets from the Pacific Division against Eastern Conference clubs because the geographic spread creates natural variation in travel demands, and the resulting sample sizes allow for clearer isolation of distance variables.
Examples From Recent Seasons
Take one stretch in the 2024-25 campaign where the Los Angeles Lakers traveled from California to Boston then immediately to Miami, a sequence exceeding 5,000 miles in under a week, and the totals in those three road contests landed under the posted number in each instance. Data from that period shows the Lakers averaged 108.3 points per game on that trip compared with their season road average of 114.7, while opponents also posted slightly lower outputs. Similar patterns appear when examining West Coast teams visiting the Northeast during winter months when weather delays add further stress to already tight schedules.
Regional Variations and Schedule Density
Teams based in the central time zone encounter different challenges because shorter flights to Eastern venues can still involve significant time changes that affect circadian rhythms, and betting markets have adjusted lines accordingly in recent years. Research published by university sports science departments demonstrates that recovery protocols such as targeted sleep scheduling and adjusted practice intensity can offset some performance declines, yet not every club applies these methods uniformly. What's interesting is how divisional opponents who face each other multiple times per season provide repeated observations of the same travel routes, allowing analysts to build more robust predictive models for totals outcomes.
Integration With Betting Market Adjustments
Oddsmakers monitor cumulative travel data and often shade lines when a road team faces an especially demanding itinerary, and public betting percentages frequently lag behind these adjustments in the first half of the season. Figures from industry reports compiled by North American gaming associations show that totals involving high-travel road teams land under the number at a slightly higher rate than league averages, though variance remains high due to individual game scripts and injuries. Those who follow these markets closely track flight manifests and reported arrival times because even small deviations from planned rest can alter expected scoring volume.
Conclusion
Travel distance continues to serve as one measurable variable among many that influence NBA road team performance in totals betting, and ongoing schedule analysis helps clarify its relative weight. As the league refines rest policies and teams adopt more sophisticated recovery strategies, the magnitude of these effects may shift, yet historical data sets provide a reliable foundation for continued examination. Observers expect further refinement of these models as additional seasons of granular tracking data become available through league partnerships with analytics providers.